Recent data indicating a 21% year-over-year increase in foreclosure filings has sparked a wave of concern across social media and financial news outlets, leading to widespread speculation regarding an impending collapse of the United States housing market. High-profile figures, including former presidential candidate Andrew Yang, have amplified these concerns, suggesting that the "pain is spreading to homeowners" and that the current foreclosure rate is the highest in seven years. However, a deeper analysis of the underlying economic data, legislative safeguards, and historical context suggests that the narrative of an imminent crash may be significantly detached from the reality of the current market structure. To understand why the modern housing market is not repeating the errors of the mid-2000s, one must examine the nuances of inventory levels, credit quality, and homeowner equity.
Historical Context: Normalization Versus Crisis
The 21% increase in foreclosure activity reported by data providers like ATTOM must be viewed within the context of the post-pandemic recovery. For nearly three years, federal and state moratoriums on foreclosures, combined with various mortgage forbearance programs, pushed foreclosure activity to historic lows. As these temporary protections expired, a "catch-up" period was inevitable. Economists argue that the current uptick represents a return to "normalization" rather than the beginning of a systemic failure.
To put the current numbers in perspective, one must look at the data provided by the New York Federal Reserve’s quarterly Household Debt and Credit Report. Historically, between 1% and 4% of mortgage loans are in some stage of delinquency during a healthy economy. During the lead-up to the 2008 Great Financial Crisis (GFC), foreclosure rates began climbing as early as 2005 and 2006, well before the broader economic recession took hold. This was the result of a massive credit boom characterized by loose lending standards and "toxic" loan products. In contrast, the current market is characterized by some of the highest credit standards in a century.
The Role of Inventory: A Supply-Demand Imbalance
One of the most significant differences between the 2008 crisis and the current market is the level of active inventory. In 2007, the U.S. housing market was flooded with approximately 4 million active listings. This oversupply, coupled with a sudden drop in demand and a wave of forced liquidations, led to a catastrophic decline in home prices.
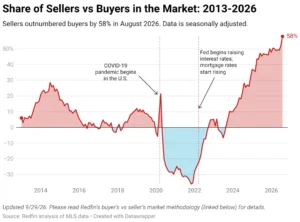
Today, the inventory landscape is vastly different. Current data shows approximately 1.56 million active listings nationwide. For the market to reach what economists consider "normal" levels, inventory would need to sit between 2 million and 2.5 million listings. Furthermore, the rate of new listings entering the market remains at historic lows. During the housing bubble of the mid-2000s, new listings frequently ranged from 250,000 to 400,000 per week. In the current environment, even during seasonal peaks, new listings have struggled to return to a standard range of 80,000 to 100,000 per week. Without a massive influx of supply—which foreclosures currently do not provide in significant volume—a price crash remains statistically unlikely.
Legislative Safeguards and the Quality of Credit
The structural integrity of the current mortgage market is reinforced by two landmark pieces of legislation that did not exist in their current form during the previous crisis: the Bankruptcy Abuse Prevention and Consumer Protection Act of 2005 and the Dodd-Frank Wall Street Reform and Consumer Protection Act of 2014.
The Dodd-Frank Act, in particular, established the "Qualified Mortgage" (QM) rule. This regulation fundamentally changed the lending landscape by requiring lenders to make a good-faith determination of a consumer’s ability to repay a mortgage. It effectively eliminated the "NINJA" loans (No Income, No Job, or Assets) and interest-only products that fueled the 2008 collapse. Consequently, the credit profiles of modern homeowners are significantly stronger than those of twenty years ago. Most borrowers today possess high credit scores and have undergone rigorous income verification, creating a "stock" of debt that is far more resilient to economic fluctuations.
The Massive Cushion of Homeowner Equity
Perhaps the most compelling argument against a foreclosure crisis is the unprecedented level of equity held by American homeowners. In 2010, at the height of the housing bust, more than 23% of all mortgaged homes were "underwater," meaning the homeowners owed more than the property was worth. This lack of equity left distressed borrowers with no choice but to go through foreclosure or a short sale.
In the current market, the situation is reversed. Approximately 40% of American homes are owned outright, with no mortgage debt whatsoever. For those who do have mortgages, the average Loan-to-Value (LTV) ratio has plummeted. In 2008, the national LTV ratio was approximately 85%; today, it stands at roughly 45.1%. This means that even if a homeowner faces financial hardship, they likely have enough equity to sell their home on the open market, pay off their debt, and walk away with a profit, rather than losing the home to the bank. This "nested equity" acts as a structural barrier against a surge in foreclosure-driven supply.
The "Lock-in Effect" and Debt Service Stability
The current interest rate environment has created a unique phenomenon known as the "lock-in effect." While mortgage rates for new buyers have fluctuated between 6% and 8% recently, the vast majority of existing homeowners are sitting on fixed-rate mortgages with rates below 6%, and many are below 4% or even 3%.
Unlike the 2008 crisis, where many borrowers held Adjustable-Rate Mortgages (ARMs) that "recast" to higher payments they could not afford, the modern borrower has a predictable monthly expense. As wages rise due to inflation and labor market tightness, the real cost of these fixed mortgage payments actually decreases over time. This stability prevents the "payment shock" that triggered the previous wave of defaults. As long as the labor market remains robust—with over 162 million Americans currently employed—the likelihood of mass defaults remains low.
The Foreclosure Process: A Long-Term Timeline
It is also vital to understand that foreclosure is a lengthy legal process, not an overnight event. A rise in "foreclosure filings" does not immediately translate to "homes for sale." The process typically begins with a 30-day late notice, followed by 60, 90, and 120-day delinquencies. Only after this period does a "Notice of Default" (NOD) or "Lis Pendens" get filed.
Depending on state laws—specifically whether a state uses a judicial or non-judicial foreclosure process—it can take anywhere from six months to several years for a property to actually hit the market as Real Estate Owned (REO) inventory. Because homeowners today have so much equity, they have the time and the financial incentive to seek loan modifications or sell the property before the process concludes. This creates a slow-moving "flow" of distressed inventory that the market can easily absorb, rather than the "flood" seen in 2008.
Broader Economic Implications and Conclusion
While the 21% year-over-year increase in foreclosures makes for a compelling headline, a data-driven analysis suggests that the US housing market is in a position of strength, not fragility. The current increase represents a recalibration toward historical norms following an era of unprecedented government intervention.
The combination of low inventory, high homeowner equity, strict lending standards, and a stable labor market creates a different economic environment than the one that led to the Great Recession. For a true foreclosure crisis to manifest, the U.S. would likely need to see a significant and sustained increase in unemployment, a total collapse of the credit markets, and a massive surge in new construction—none of which are currently reflected in the data.
Investors, policymakers, and the public should remain vigilant regarding economic shifts, but the comparison to 2008 remains largely unfounded. The housing market of 2024 is defined by fixed-rate stability and equity cushions, providing a robust defense against the "doom" narratives currently circulating in the mainstream media. The focus, according to many housing experts, should remain on the genuine challenge of the modern market: a lack of affordable supply for new buyers, rather than a surplus of distressed properties from existing owners.