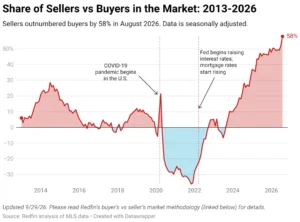
The United States housing market, which has demonstrated a surprising degree of fortitude throughout the first half of 2026, is facing a renewed set of challenges as geopolitical tensions and macroeconomic pressures converge. Despite the persistent headwinds of elevated inflation, volatile oil prices, and the transformative anxiety surrounding artificial intelligence’s impact on the labor market, residential real estate has largely held its ground. However, as the conflict between the United States and Iran enters a volatile new phase—frequently referred to as "Stage 2.0"—and mortgage rates hover near critical psychological and technical thresholds, analysts are questioning whether the market’s stability can endure. The current tracker of housing data suggests a burgeoning slowdown, influenced heavily by a ten-year Treasury yield that remains at the upper bound of annual forecasts and mortgage rates that have consistently remained above the 6.64% mark over the past week.
The Geopolitical Catalyst: Iran Conflict 2.0 and Energy Markets
The escalation of the Iran conflict has emerged as a significant "black swan" variable in the 2026 economic outlook. Following a series of strikes and counter-strikes reported in mid-July, the geopolitical situation has shifted from a localized regional concern to a primary driver of global market volatility. For the housing market, the primary transmission mechanism of this conflict is the price of energy. As oil prices climb in response to instability in the Middle East and threats to shipping lanes in the Strait of Hormuz, the Federal Reserve’s path toward interest rate normalization becomes increasingly obscured.
Historically, the Federal Reserve has maintained a sensitive posture toward energy-driven inflation. While central bank officials often suggest they "look through" temporary spikes in volatile food and energy costs, the reality in 2026 is that sustained high oil prices threaten to de-anchor inflation expectations. During the past week, "hawkish" members of the Federal Open Market Committee (FOMC) have been vocal about the risks posed by this conflict. Their rhetoric suggests that if energy prices continue to put upward pressure on the Consumer Price Index (CPI), the prospect of rate cuts remains distant, and the possibility of further tightening—or at least a "higher for longer" stance—is reinforced.
The 10-Year Yield and the 6.64% Mortgage Threshold
Central to the housing market’s performance is the 10-year Treasury yield, which serves as the benchmark for long-term borrowing costs. In the HousingWire 2026 forecast, analysts anticipated a specific trading channel for both bond yields and mortgage rates. To date, the market has remained within these forecasted ranges, but it is currently testing the upper limits. The 10-year yield’s ascent, driven by both the Fed’s hawkishness and the geopolitical risk premium, has pushed mortgage rates back into a territory that has historically stifled buyer demand.
Data from the past three years indicates that the U.S. housing market encounters significant friction whenever mortgage rates exceed 6.64%. This specific level appears to be a tipping point where affordability constraints outweigh the "buy now" incentive for many households. While rates behaved with relative stability last week despite the barrage of negative headlines regarding the Iran conflict, they remain uncomfortably close to the 7% mark. The resilience of the market at these levels is being tested daily, particularly as the "lock-in effect"—where homeowners are reluctant to trade their existing low-rate mortgages for new, more expensive ones—continues to suppress overall turnover.
The Role of Mortgage Spreads in Preventing a Market Collapse
One of the most critical, yet often overlooked, factors in the 2026 housing narrative is the narrowing of mortgage spreads. The spread represents the difference between the 10-year Treasury yield and the 30-year fixed-rate mortgage. In a typical economic environment, this spread ranges between 1.60% and 1.80%. However, during the volatility of 2023 and 2024, spreads widened significantly, at times exceeding 3.00% due to secondary market instability and bank hedging concerns.
In 2026, improved mortgage spreads have acted as a vital buffer for the industry. Last week, spreads were recorded at 1.97%, a slight increase from 1.95% the previous week, but still remarkably lower than the levels seen two years ago. Had the spreads remained at 2023 levels, current mortgage rates would likely be hovering near 8%. Even at 2025 levels, rates would have consistently stayed above 7% for the duration of the year. This relative improvement in spreads has prevented a total freeze in mortgage originations, allowing the market to maintain a slow but steady pulse despite the high-yield environment.
Analysis of Demand: Pending Sales and Purchase Applications
As the market enters the second half of July, the data on buyer demand is beginning to show signs of a seasonal and macro-induced retreat. Weekly pending home sales, which offer a high-frequency look at market activity, showed a slight negative trend on a year-over-year basis. While the market saw a traditional rebound following the Fourth of July holiday lull, the overall trajectory is cooling. It is important to note that pending sales typically take 30 to 60 days to manifest in closed sales data, suggesting that the "August and September" reports may reflect a more pronounced slowdown.
Similarly, mortgage purchase application data—a leading indicator of future home buying activity—fell by 7% on a week-to-week basis. While a weekly decline is seasonally expected for this period in July, the 2% year-over-year decrease is more telling. This marks only the third negative year-over-year print of 2026, indicating that the buyer pool is finally beginning to feel the cumulative weight of high rates and geopolitical uncertainty. Moving forward, year-over-year comparisons will become increasingly "difficult," as the housing market experienced a notable shift in momentum in mid-June of the previous year. To show growth, the 2026 market will need to outperform a period in 2025 where rates were lower and sentiment was improving.
Inventory Trends and the "New Listing" Ceiling
The supply side of the housing equation remains the primary support for home prices. Inventory growth has slowed considerably since mid-June 2025, with many recent weeks showing negative year-over-year growth. The seasonal peak for new listings, which traditionally sees between 80,000 and 100,000 homes hit the market weekly, has been underwhelming in 2026. The market has only surpassed the 80,000-listing threshold four times this year, and never in consecutive weeks.
Despite this scarcity, the 2025 and 2026 listing data remains healthier than the "inventory desert" experienced in 2023 and 2024. This marginal increase in supply is largely attributed to the fact that many current sellers are also buyers, creating a "move-up" or "move-down" cycle that provides some liquidity to the market. However, any comparison to the "housing bubble" years of 2006-2008 is factually unfounded; during that era, new listings routinely ranged from 250,000 to 400,000 per week. The current market is defined by scarcity, not an oversupply of distressed assets.
Price Dynamics and the Percentage of Price Cuts
In a typical, healthy housing market, approximately one-third of all listings undergo a price reduction before a sale is finalized. In 2026, the percentage of price cuts has remained lower than in the previous year, a direct result of the slowing inventory growth. When supply is tight, sellers feel less pressure to lower their asking prices, even if demand is tepid.
This lack of downward price pressure has challenged initial forecasts for 2026. While some analysts, including those at HousingWire, predicted a modest national home price decline of roughly 0.62% for the year, current indexes show prices are actually growing at a rate of 1% to 2%. While this is a significant deceleration from the double-digit growth seen during the pandemic era, it highlights the "sticky" nature of home prices in a low-inventory environment. Affordability remains a major concern, but as long as wages continue to outpace the marginal growth in home prices, a catastrophic correction remains unlikely.
Looking Ahead: Market Sentiment and the Week of July 20th
As the market looks toward the final full week of July, all eyes remain on the Middle East. The "Iran Conflict 2.0" is uniquely impactful because, unlike previous escalations that occurred primarily over weekends or during market closures, the current hostilities are playing out during active trading hours. This creates a real-time feedback loop between geopolitical news, oil futures, and bond yields.
In addition to the conflict, the coming week will feature several critical data releases and financial events, including new home sales reports and significant Treasury bond auctions. The results of these auctions will be a litmus test for investor appetite for U.S. debt amidst global instability. If the auctions see weak demand, yields could spike further, potentially pushing mortgage rates past the 7% threshold and into a zone that could trigger a more severe contraction in housing activity.
The 2026 housing market has proven its ability to "hold its own" against a backdrop of chaos. However, with the confluence of a renewed international conflict, a hawkish Federal Reserve, and a technical ceiling on mortgage rates, the "summer of resilience" is facing its most rigorous examination yet. Whether the market can maintain its current trajectory will depend largely on whether the 10-year yield can stay within its forecasted channel or if the "2.0 stage" of the Iran conflict forces a new, more restrictive economic reality.