The Suffolk County housing market presented a deeply contradictory economic portrait in August 2026, delivering a mix of record-setting price growth and cooling transaction activity that caught the attention of regional real estate analysts. While the county’s median sale price climbed at its fastest annual clip in over a year, reaching $857,131 and representing a substantial 7.3% jump year-over-year, this headline strength effectively masked an underlying pullback in overall sales volume and a rapid, highly unusual accumulation of unsold housing inventory.
For much of the post-pandemic era, Greater Boston’s urban core has been defined by chronic supply shortages, intensely competitive bidding wars, and aggressive price escalations that routinely priced out middle-class buyers. However, the August 2026 data indicates a profound structural pivot. Suffolk County now sits at roughly four months of housing supply—the highest level among Greater Boston’s core counties—aligning it closely with national inventory averages for the first time in recent memory. This transition highlights an urban market actively wrestling with elevated condominium inventory, prolonged days on market, and persistent macroeconomic affordability headwinds that have tempered buyer urgency heading into the autumn season.
Divergence Between Local Realities and National Trends
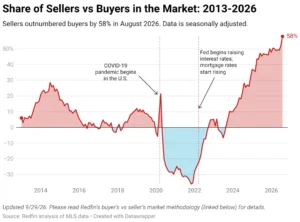
To fully understand the current dynamics of Suffolk County, real estate economists evaluate local metrics against broader national shifts. Across the United States, the housing market faced notable friction in August 2026. Stubborn inflation, combined with an economy increasingly driven by artificial intelligence investments and fluctuating monetary policies, kept mortgage rates stubbornly high. Nationally, the median home sale price crept up by a modest 2.2% to $398,596, pending sales fell by 1.3% to 336,973, and active listings rose by 2.7% to 1.53 million. Across the country, sellers continued to outnumber buyers by nearly 58%, and the typical home spent 50 days on the market.
Suffolk County diverged sharply from this national baseline in terms of pure price appreciation, registering a 7.3% surge compared to the national average of 2.2%. Yet, the county converged remarkably with the rest of the nation regarding supply. At approximately four months of inventory, Suffolk County’s market saturation mirrored the national norm—a stark departure from historical readings that routinely lingered below two months of supply through 2024.
Chen Zhao, Redfin’s head of economics research, contextualized the broader economic pressures shaping these trends. “The U.S. housing market faced some hurdles in August, as inflation and an AI-fueled economy kept mortgage rates high and weighed heavily on homebuyers, sellers, and investors,” Zhao explained. “Until recently, affordability and activity had been slowly improving for months, helping the market recover. But now, economic uncertainty and rising prices are keeping more people on the sidelines and slowing the market further. For buyers who need to buy, now is a great time because there’s less competition and a bit more inventory—for sellers, pricing competitively is key to attract attention.”
Price Growth Outpaces Broad-Based Demand
A granular examination of Suffolk County’s 7.3% median price increase reveals a nuanced story of market composition rather than uniform appreciation. The typical home in the county commanded $857,131 in August. However, the price per square foot rose by a much more modest 1.0% to $654. This statistical divergence strongly indicates that the headline price surge was driven in large part by compositional shifts—specifically, a higher concentration of larger, premium, or luxury properties making up a disproportionate share of completed closings.
Furthermore, traditional indicators of seller leverage softened across the board. The average home in Suffolk County sold for approximately 1.4% below its initial list price, and roughly 16% of active listings required a price reduction before finding a buyer. This contrasted sharply with the aggressive over-asking environment that characterized previous years. While the 7.3% gain represented the strongest price growth in Greater Boston, actual sales volume contracted significantly. Total homes sold fell by 9.7% year-over-year to 466, while pending sales dropped by 7.3% to 390. These metrics highlight a bifurcated market where fewer, higher-priced transactions artificially inflate the median price while underlying transaction velocity slows.
Cooling Urban Demand and Elongated Days on Market
The cooling of urban demand in Suffolk County became increasingly apparent through metrics tracking transaction speed and market competitiveness. In August, the median home went under contract in 39 days—representing an increase of five days compared to the previous year and nearly double the pace observed in neighboring suburban counties such as Middlesex and Norfolk.
Only about 25% of homes closed above their asking price, marking a decline of roughly three percentage points year-over-year. While Suffolk County’s 39-day market duration was technically faster than the national average of 50 days, the year-over-year deceleration was notably pronounced. Real estate analysts attribute this shift to the unforgiving affordability ceiling imposed by an $857,000 median price point within a housing stock heavily dominated by condominiums and multi-family structures.
As affordability constraints tighten, prospective buyers are increasingly finding themselves priced out of desirable urban pockets, leading to diminished competition and longer negotiation windows for properties that fail to capture immediate interest.
Inventory Surge Reaches Balanced-Market Thresholds
Perhaps the most structurally significant development in Suffolk County’s August 2026 housing data was the aggressive expansion of active inventory. Active listings climbed by approximately 16% year-over-year to 2,608, while new listings jumped by a dramatic 27% to 542. Consequently, the months of supply metric climbed to approximately four months—marking an increase of roughly one-third compared to the same period in 2025 and approaching the classic economic threshold for a balanced housing market.
This inventory accumulation was driven by a dual mechanism: an influx of new construction deliveries in high-density urban areas like Boston’s Seaport and downtown districts, combined with the persistent difficulty of moving existing condominium inventory priced at or near historical peaks. As new listings entered the market while buyer demand softened due to elevated financing costs, the age of unsold inventory extended well past historical county norms.
Price-Tier Disparities: Luxury Resilience Versus Starter Stall
A closer review of market segmentation across different price tiers reveals stark contrasts in buyer behavior and price appreciation throughout Suffolk County. Data compiled from the Multiple Listing Service (MLS) for the rolling three-month period ending in August 2026 underscores how different economic brackets are performing:
- Luxury Tier (Top 5%): The median price in this segment reached $2,974,650, marking a robust 6.6% year-over-year increase. High-end buyers remained exceptionally decisive, with days on market dropping by five days to 25. However, the percentage of luxury homes selling above list price declined by six percentage points to 13.0%, indicating that even affluent buyers were less willing to engage in aggressive bidding wars.
- High Tier (65th to 95th Percentile): Recording a median price of $1,199,645 (+2.5% YoY) and 648 total sales, this segment demonstrated steady stability with homes averaging 23 days on market.
- Non-Luxury Tier (35th to 65th Percentile): This segment emerged as the most intensely competitive bracket in the county. With a median price of $758,238 (+3.5% YoY), mid-market condos and townhomes posted the highest above-list sale rate at 40.7%, proving that middle-tier buyers were fiercely competing for reasonably priced functional space.
- Starter Tier (5th to 35th Percentile): The entry-level market effectively stalled. Median prices barely budged, rising a negligible 0.9% to $530,063, while sales volume dipped by 1.7%. Days on market increased by four days to 27, signaling that first-time buyers were hitting a severe affordability ceiling rather than enjoying a lack of available choices.
- Bottom Tier (Bottom 5%): Recording a median price of $305,933 (-2.4% YoY) and flat sales volume, this segment reflected ongoing financial pressures on the lowest end of the property spectrum.
Municipal Breakdown Across Suffolk County
Housing dynamics varied considerably when examining individual municipalities within Suffolk County during the June through August 2026 period:
- Boston: Serving as the primary economic engine of the county, Boston posted a median sale price of $859,431, representing a modest 3.4% year-over-year increase. The city recorded 1,613 closed sales, 1,932 new listings, and 3,998 active listings. Homes spent an average of 26 days on the market, with 30.3% selling above asking price and a supply index of 3.2 months.
- Revere: Revere experienced explosive price appreciation, with its median sale price surging 21.5% year-over-year to $704,534. Driven by 93 closed sales and 140 new listings, the city maintained rapid market velocity with an average of just 22 days on market. Over half of all homes (50.6%) sold above asking price, supported by a lean supply of 2.9 months.
- Winthrop / Winthrop Town: In contrast to Revere’s rapid ascent, Winthrop experienced a notable pricing correction. The median sale price dropped 13.3% year-over-year to $628,584. Across 50 closed sales and 84 new listings, homes averaged 23 days on market, with 36.8% selling above list price and supply expanding to 4.8 months.
Strategic Guidance for Buyers and Sellers
The convergence of rising inventory, cooling demand, and slowing transaction velocity requires a recalibration of strategy for real estate participants entering the autumn market.
For prospective buyers, the August 2026 data unveils the most accommodating market conditions observed in years. With months of supply resting at four, an average market duration of 39 days, and only a quarter of properties fetching above-asking bids, market leverage has shifted perceptibly toward purchasers. Buyers are encouraged to target starter and mid-tier properties where price growth has moderated, and they should feel empowered to submit offers below asking price on inventory that has lingered past the three-week threshold.
For sellers, the reality of the headline 7.3% price increase must be balanced against the underlying contraction in sales volume and the rising frequency of price reductions. Sellers—particularly those marketing condominiums and multi-family properties—are strongly advised to price competitively from the outset. The data clearly demonstrates that overpriced properties are being heavily penalized by a more discerning buyer pool. While luxury vendors continue to command healthy per-unit prices, the era of effortless multiple-offer scenarios has largely subsided outside of select non-luxury pockets.
Disclaimer: Real estate data cited in this report is derived from MLS analytics and Redfin research for Suffolk County, MA. Readers and prospective market participants should independently verify all financial, legal, and structural data before executing real estate transactions. This information does not constitute formal financial, legal, or licensed brokerage advice.