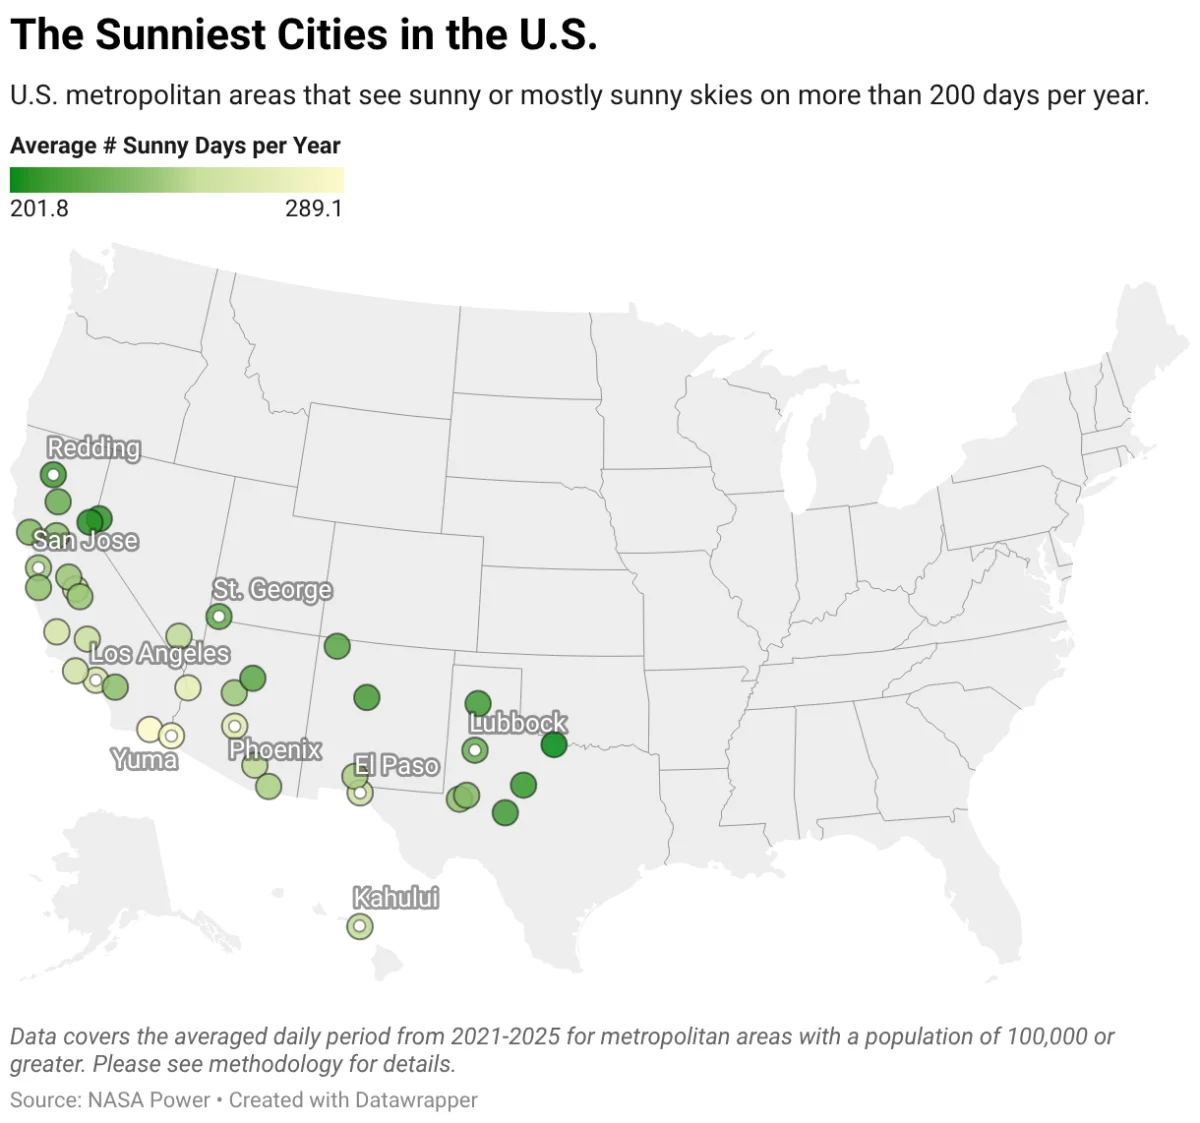
The ongoing migration toward warmer and brighter climates across the United States has continued to reshape domestic real estate markets and regional demographics. In an effort to quantify this geographical shift, new real estate data highlights the nation’s top metropolitan areas for year-round sunshine. Driven by remote work flexibility, lifestyle preferences, and the enduring appeal of the American Southwest, cities offering high annual totals of clear skies remain primary destinations for relocating households, even as modern challenges such as extreme weather, fluctuating housing inventory, and rising insurance costs complicate the relocation process.
Main Facts and Geographic Distribution
When measuring annual meteorological brightness, desert communities across the American Southwest consistently dominate national rankings. According to comprehensive metrics compiled from multi-year atmospheric data, the top-tier sunniest cities in the United States experience nearly cloudless skies for upwards of 250 to nearly 290 days per year.
At the very top of the national rankings stand El Centro, California, and Yuma, Arizona. El Centro records approximately 289 predominantly sunny days per year, closely followed by Yuma at 288 days. Rounding out the top tier are Lake Havasu City, Arizona, with 272 days, and Phoenix, Arizona, with 269 days. Other notable metropolitan areas featuring prominently in the upper echelon of national sunshine metrics include Los Angeles, San Luis Obispo, and Oxnard in California, alongside El Paso, Texas.
These regions owe their persistent brightness primarily to geographic and atmospheric phenomena. Nearly all top-ranking cities are situated within the major North American desert ecosystems—specifically the Sonoran, Mojave, and Chihuahuan Deserts. The stable atmospheric pressure systems typical of these desert regions suppress cloud formation, resulting in high percentages of possible sunshine and elevated solar irradiance levels, frequently exceeding 5.8 to nearly 6.0 kilowatt-hours per square meter daily.
Chronology and Historical Context of Sun Belt Migration
The mass movement of Americans toward southern and western states is not a novel phenomenon, though its drivers and intensity have evolved significantly over time. For more than six decades, the Sun Belt—a vast geographical band stretching across the southern third of the country from California through the Southwest, Texas, and across the Southeast—has experienced accelerated population growth relative to the industrial Northeast and Midwest.
During the mid-to-late 20th century, this expansion was largely fueled by defense manufacturing, the proliferation of air conditioning, and affordable land that enabled rapid suburban development. Retirees and industrial workers alike migrated southward in search of economic opportunity and milder winters.
The trend experienced a dramatic acceleration following the onset of the COVID-19 pandemic in 2020. The sudden, widespread adoption of remote work untethered white-collar professionals from specific geographic job centers. Freed from daily commutes, millions of Americans reevaluated their living situations, prioritizing square footage, outdoor recreational access, and climate. This pandemic-era housing boom drove unprecedented demand into Sun Belt housing markets, pushing home prices and construction activity to historic highs throughout 2021 and 2022.
By 2026, this migration pattern matured. While the initial frenzy of pandemic relocation leveled off, the structural preference for southern climates persisted. However, the housing markets accommodating these new arrivals faced a shifting economic and environmental landscape, characterized by cooling overall demand in specific overheated metros, rising construction of new housing inventory, and mounting fiscal pressures related to property insurance and climate risks.
Supporting Data and Comparative Metrics
Evaluating urban sunniness requires looking beyond simple binary metrics of "clear" versus "cloudy" days. Meteorologists and climatologists typically analyze three core indicators: average annual sunny and mostly sunny days, percentage of possible sunshine (estimated daylight hours receiving direct solar radiation), and solar irradiance.
A detailed examination of top U.S. metropolitan areas with populations exceeding 100,000 illustrates these distinct parameters:
- El Centro, CA: 289 average sunny days per year, 88% possible sunshine (3,884 hours/year), 5.93 kWh/m²/day solar irradiance.
- Yuma, AZ: 288 average sunny days per year, 89% possible sunshine (3,947 hours/year), 5.97 kWh/m²/day solar irradiance.
- Lake Havasu City, AZ: 272 average sunny days per year, 88% possible sunshine (3,910 hours/year), 5.85 kWh/m²/day solar irradiance.
- Phoenix, AZ: 269 average sunny days per year, 87% possible sunshine (3,876 hours/year), 5.85 kWh/m²/day solar irradiance.
- Los Angeles, CA: 264 average sunny days per year, 84% possible sunshine (3,704 hours/year), 5.65 kWh/m²/day solar irradiance.
- San Luis Obispo, CA: 260 average sunny days per year, 82% possible sunshine (3,629 hours/year), 5.54 kWh/m²/day solar irradiance.
- Oxnard, CA: 255 average sunny days per year, 80% possible sunshine (3,565 hours/year), 5.51 kWh/m²/day solar irradiance.
- El Paso, TX: 255 average sunny days per year, 86% possible sunshine (3,816 hours/year), 5.90 kWh/m²/day solar irradiance.
- Bakersfield, CA: 252 average sunny days per year, 82% possible sunshine (3,653 hours/year), 5.58 kWh/m²/day solar irradiance.
- Madera, CA: 251 average sunny days per year, 83% possible sunshine (3,673 hours/year), 5.52 kWh/m²/day solar irradiance.
Seasonal variations also alter regional patterns. Desert locations generally record their peak uninterrupted sunshine from April through June, prior to the onset of regional monsoon seasons in late summer. Conversely, northern and coastal California zones—such as Truckee and Chico—often experience maximum clear-sky consistency during the peak of summer months.
Real Estate and Economic Implications
The sustained influx of residents into sun-drenched regions has generated profound economic and real estate implications. While the promise of year-round outdoor activity and vitamin D offers undeniable lifestyle benefits, the concentration of housing demand in specific southern metros has triggered significant affordability challenges.
During the height of post-pandemic migration, rapid price appreciation priced out many long-term local residents across the Sun Belt. Although cooling market conditions and higher interest rates have moderated price growth or initiated slight corrections in select overheated submarkets, the overall cost of homeownership in these regions has not necessarily declined.
Real estate analysts and industry observers point to secondary ownership costs as a growing factor in relocation decisions. Surging homeowners insurance premiums—driven by escalating replacement costs, severe weather events, and climate-related risks such as extreme heat, prolonged droughts, and localized flooding—are adding substantial financial burdens to property owners. Consequently, prospective buyers are increasingly urged to look beyond basic climate appeal and evaluate total ownership costs, including Homeowners Association (HOA) fees, energy requirements for cooling, and long-term climate vulnerability.
To address these complexities, modern real estate platforms have integrated advanced data tools. Prospective buyers now frequently utilize micro-climate metrics, solar exposure simulations, and automated climate risk assessments before purchasing property. These tools allow consumers to evaluate precise daily sunlight hours, historical weather patterns, and specific environmental risks for individual parcels of land, bridging the gap between lifestyle aspirations and practical risk management.
Broader Socioeconomic Impact
The ongoing attraction to America’s sunniest cities reflects a broader cultural and economic reorganization. As remote and hybrid work models institutionalize flexibility, geographical location is increasingly decoupled from traditional employment hubs. Cities in the American Southwest and Sun Belt continue to adapt to this permanent demographic shift by expanding municipal infrastructure, investing in renewable energy generation—particularly solar power, which benefits directly from high irradiance levels—and diversifying their local economies.
At the same time, municipal leaders face mounting responsibilities in managing resource allocation, particularly concerning water management, urban heat island mitigation, and sustainable growth. The long-term viability of rapid urban expansion in hyper-arid climates depends heavily on balancing economic development with ecological conservation.
Ultimately, while the pursuit of sunshine remains a powerful motivator for American households seeking a change of scenery, navigating the modern housing market requires a nuanced evaluation of economic realities, climate factors, and structural costs. As data transparency improves, homebuyers are increasingly equipped to make informed decisions that weigh the undeniable appeal of clear skies against the practical realities of long-term regional living.